
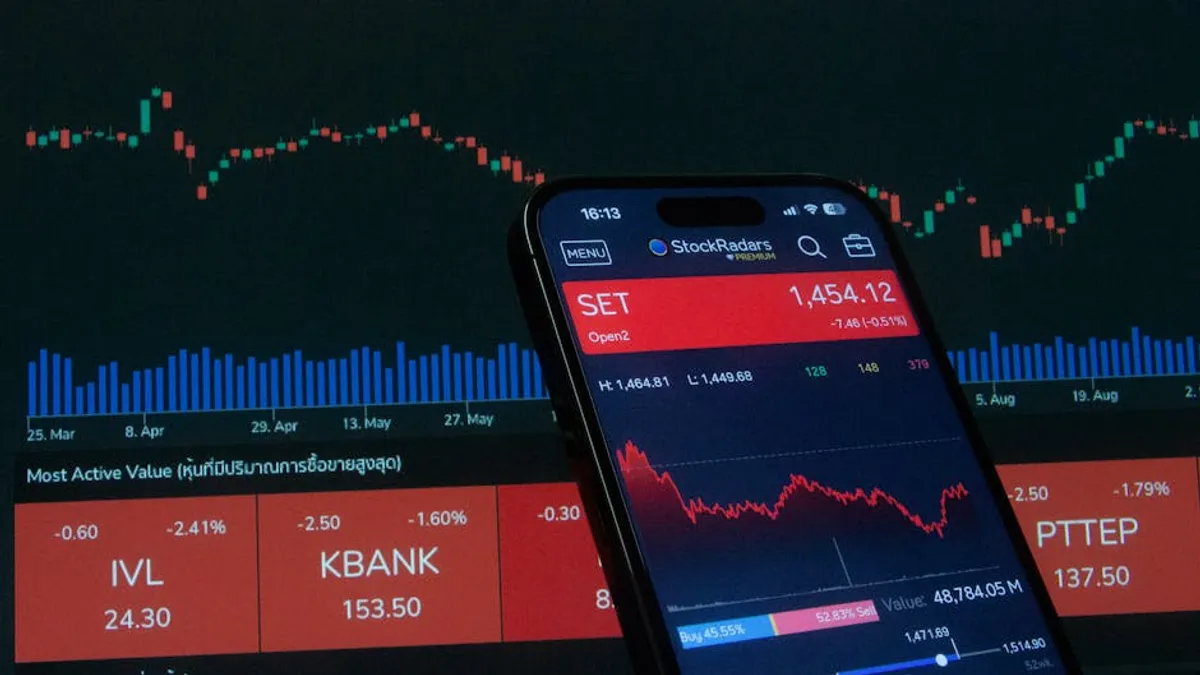
Understanding NSE stock updates requires more than just glancing at daily price changes. For investors and traders, the ability to interpret market movements from raw data provides a critical edge, informing decisions that align with specific financial objectives. This involves dissecting various data points, recognizing patterns, and contextualizing information within broader economic and company-specific narratives. Developing this skill set allows for a more disciplined approach to capital allocation, moving beyond speculative reactions to a framework built on analytical rigor.
Understanding Core NSE Market Data
The foundation of interpreting NSE market movements lies in a clear understanding of the primary data points released daily. These are not merely numbers; they represent the collective actions and sentiments of millions of participants.
Price and Volume Dynamics
Price data, including Open, High, Low, and Close (OHLC), forms the immediate picture of a stock's performance. The difference between the open and close price indicates daily direction, while the range between high and low reflects volatility. Volume, the number of shares traded, is equally critical. High volume accompanying a significant price move often confirms the strength of that move, suggesting broad market participation. Conversely, a large price change on low volume might indicate a less robust trend, potentially driven by fewer participants.
Example: A stock closing significantly higher than its open, with trading volume well above its 30-day average, suggests strong buying interest and potential continuation of the upward trend. If the same price increase occurred on below-average volume, it might be viewed with skepticism regarding its sustainability.
Key Derivatives and Market Breadth Indicators
Beyond spot prices, derivative data offers forward-looking insights. Open Interest (OI) in Futures and Options contracts indicates the total number of outstanding contracts not yet settled. A rising OI alongside a rising price in futures can signal strong conviction in the upward trend. Similarly, Put-Call Ratio (PCR) derived from options data reflects market sentiment; a high PCR suggests more puts (bearish bets) than calls (bullish bets), potentially signaling an oversold market ripe for a reversal, or vice-versa.
Market breadth indicators, such as the Advance-Decline Line (ADL), compare the number of advancing stocks to declining stocks across the entire exchange. A rising ADL, even if the main index is flat, suggests underlying strength in the broader market, indicating that more stocks are participating in an uptrend.
Applying Technical Analysis to NSE Stocks
Technical analysis involves studying historical price and volume charts to identify patterns and predict future price movements. It operates on the premise that all known information is already reflected in the stock's price.
Charting Patterns and Support/Resistance
Candlestick charts are fundamental for visualizing OHLC data and identifying short-term sentiment. Patterns like 'Engulfing Bar' or 'Doji' can signal potential reversals or continuations. Understanding support and resistance levels is crucial; support is a price level where buying interest is strong enough to prevent the price from falling further, while resistance is where selling interest is sufficient to halt an advance. These levels are often established by previous highs or lows and can act as psychological barriers for traders.
Key Technical Indicators for NSE Markets
Several mathematical indicators help quantify market conditions and identify potential entry/exit points:
- Moving Averages (MAs): Smooth out price data to identify trend direction. A shorter-term MA crossing above a longer-term MA (e.g., 50-day MA crossing 200-day MA) is often a bullish signal, known as a 'golden cross'.
- Relative Strength Index (RSI): A momentum oscillator measuring the speed and change of price movements. RSI values above 70 indicate overbought conditions, while values below 30 suggest oversold conditions, potentially signaling a price reversal.
- Moving Average Convergence Divergence (MACD): A trend-following momentum indicator showing the relationship between two moving averages of a security’s price. A MACD crossover above its signal line can indicate a bullish momentum shift.
- Bollinger Bands: Volatility bands placed above and below a simple moving average. Prices tend to stay within the bands, and a squeeze in the bands often precedes a period of increased volatility.
Integrating Fundamental Insights
While technical analysis focuses on price action, fundamental analysis assesses a company's intrinsic value by examining economic, industry, and company-specific factors. Combining both approaches provides a more comprehensive view.
Company Financials and Valuation Metrics
Key financial metrics from quarterly and annual reports provide insight into a company's health. Earnings Per Share (EPS), Price-to-Earnings (P/E) ratio, Debt-to-Equity ratio, and Return on Equity (ROE) are critical. A consistently growing EPS indicates profitability, while a reasonable P/E ratio compared to industry peers suggests fair valuation. High debt-to-equity might signal financial risk, especially in volatile markets.
Industry Trends and Macroeconomic Factors
A company does not operate in a vacuum. Understanding the broader industry trends—such as growth prospects, competitive landscape, and regulatory changes—is essential. Macroeconomic indicators like GDP growth, inflation rates, interest rate policies by the Reserve Bank of India, and global economic conditions directly impact corporate earnings and investor sentiment across the NSE.
Deciphering Market Sentiment and News Flow
Market sentiment, the overall attitude of investors towards a particular stock or the market, can significantly influence price movements, often overriding technical or fundamental signals in the short term.
Corporate Announcements and Regulatory Updates
News releases from companies, such as earnings reports, mergers and acquisitions, new product launches, or management changes, can cause immediate and substantial price shifts. Similarly, regulatory changes by SEBI or government policy announcements can impact entire sectors or specific companies listed on the NSE. Staying informed through official channels and reputable financial news sources is paramount.
Pro Tip: Avoid chasing news-driven spikes without confirming the underlying fundamentals or technical support. Often, initial reactions to news are exaggerated, and prices may revert as the market processes the information more thoroughly. Focus on how the news impacts the company's long-term value proposition.
Constructing Your Market Reading Framework
An effective framework for reading NSE market movements integrates these diverse analytical approaches into a coherent strategy.
Step 1: Macro-to-Micro Scan: Begin with the broader market and economic outlook. Is the Nifty 50 in an uptrend or downtrend? What are the prevailing interest rate expectations? This sets the context.
Step 2: Sectoral Analysis: Identify sectors that are outperforming or underperforming. Are there specific tailwinds or headwinds for certain industries (e.g., IT, banking, manufacturing)?
Step 3: Company-Specific Deep Dive: Within attractive sectors, analyze individual stocks using both fundamental and technical lenses. Check financial health, valuation, and then look for favorable chart patterns and indicator signals.
Step 4: Risk Management: Define your entry and exit points, set stop-losses, and determine position sizing based on your risk tolerance. No amount of market reading can eliminate risk entirely, but it can help manage it.
Actionable Steps for Informed Trading
Consistently interpreting NSE stock updates requires discipline and continuous learning. Establish a routine for reviewing market data before and after trading hours. Utilize screening tools to filter for stocks meeting your specific criteria, whether based on technical indicators, fundamental ratios, or news catalysts. Regularly review your past trades to understand what worked and what didn't, refining your analytical framework over time. Focus on understanding the 'why' behind market movements, rather than just the 'what'. This analytical rigor is a continuous process, not a one-time skill acquisition.
Frequently Asked Questions
What is the most important indicator for NSE stock analysis?
There isn't a single "most important" indicator; effective analysis combines multiple data points. Price and volume are foundational, but technical indicators like RSI or MACD, alongside fundamental metrics like EPS and P/E, provide a more robust picture when used together.
How often should I check NSE stock updates?
The frequency depends on your trading or investing style. Day traders might monitor real-time data, while long-term investors might check daily or weekly. For most, a daily review of key market updates, company news, and chart patterns is sufficient to stay informed without over-reacting to short-term noise.
Can technical analysis alone predict NSE stock movements?
Technical analysis identifies probabilities based on historical patterns, but it does not guarantee future outcomes. It is most effective when combined with fundamental analysis to ensure the underlying company has sound financial health and growth prospects, providing a holistic view of the investment.
What role does global news play in NSE stock movements?
Global economic news, such as interest rate changes by major central banks, geopolitical events, or commodity price fluctuations, can significantly impact the NSE. India's economy is increasingly integrated globally, so these external factors influence investor sentiment, foreign institutional investment flows, and corporate earnings, affecting stock prices across various sectors.