
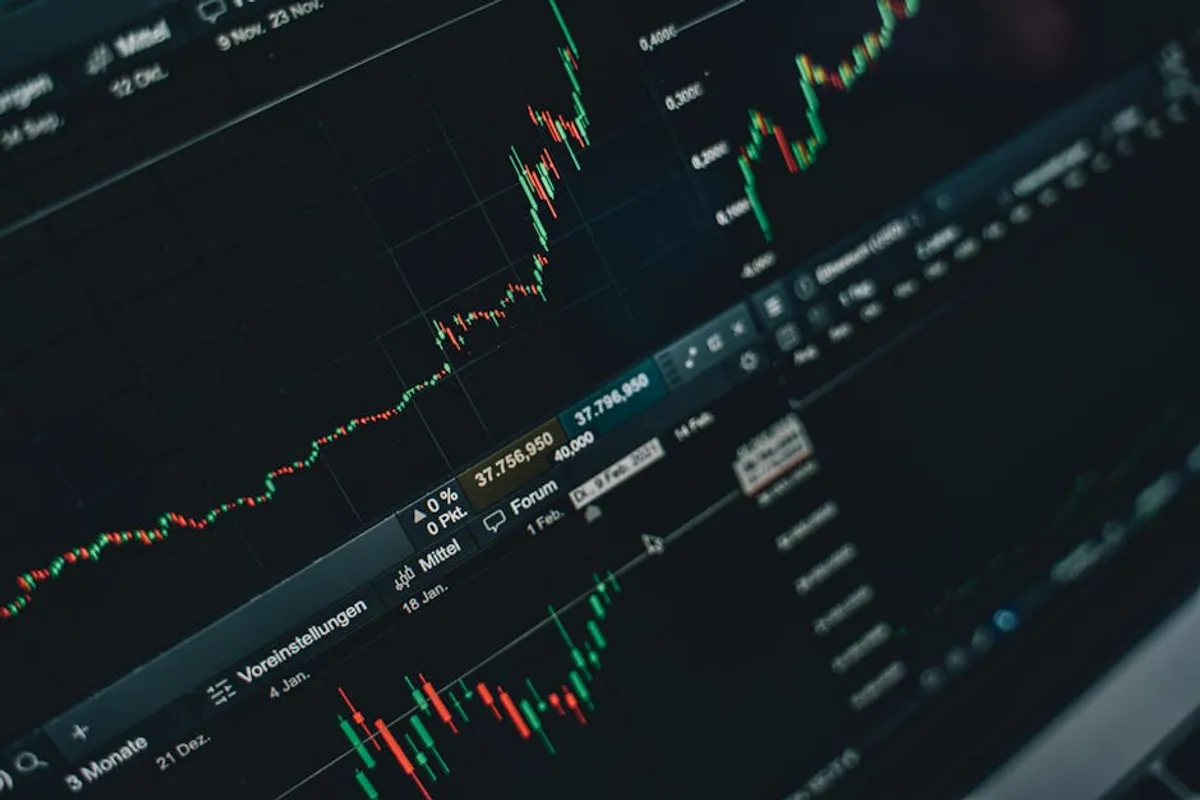
Navigating the stock market daily requires a structured approach to filter noise from actionable signals. For investors, marketers, and business strategists, understanding the immediate drivers of market sentiment and price action is critical. This isn't about predicting the future, but about identifying the key catalysts that move sectors, asset classes, and individual equities within a 24-hour cycle. The commercial utility lies in anticipating shifts that can impact portfolio performance, inform content strategies around market trends, or guide business decisions influenced by economic sentiment.
Key Economic Indicators to Monitor
Economic data releases provide a macro lens through which to view market health. These reports often dictate central bank policy, which in turn influences borrowing costs, corporate profitability, and investor risk appetite.
Inflation Data: CPI and PPI
The Consumer Price Index (CPI) and Producer Price Index (PPI) are critical for gauging inflationary pressures. CPI measures changes in the prices of goods and services purchased by consumers, directly impacting purchasing power and consumer spending. PPI tracks average changes in selling prices received by domestic producers for their output, signaling potential future shifts in CPI. Higher-than-expected inflation often prompts central banks to consider interest rate hikes, which can dampen equity valuations by increasing the cost of capital and making fixed-income assets more attractive. Conversely, cooling inflation might suggest a more accommodative monetary policy, potentially boosting growth stocks.
Employment Reports: Non-Farm Payrolls and Unemployment Rate
Labor market strength is a cornerstone of economic health. The monthly Non-Farm Payrolls report details the number of new jobs created in the U.S. economy, excluding agricultural, government, private household, and non-profit organization employees. The Unemployment Rate indicates the percentage of the labor force that is unemployed but actively seeking employment. Robust job growth and low unemployment typically signal strong consumer spending and a healthy economy, which are positive for corporate earnings. However, an overheated labor market can also fuel inflation, leading to the same rate-hike concerns as high CPI/PPI figures. Weak reports, conversely, can signal economic contraction and lead to market apprehension.
Interest Rate Decisions from Central Banks
Statements and decisions from central banks like the Federal Reserve (Fed), European Central Bank (ECB), and Bank of England (BoE) are paramount. Their interest rate policies directly affect the cost of borrowing for businesses and consumers, influencing investment, spending, and economic growth. A hawkish stance (raising rates or signaling future hikes) typically weighs on growth-oriented sectors and can strengthen the respective currency. A dovish stance (lowering rates or signaling cuts) tends to support risk assets like equities and can weaken the currency. Investors watch for forward guidance on future policy, often more impactful than the immediate rate decision itself.
Corporate Earnings and Sector Performance
While macro data sets the stage, individual company reports and broader sector trends provide granular insights into market dynamics.
Individual Company Earnings Reports
For specific stocks, quarterly earnings reports are the most significant daily catalyst. These reports detail a company's revenue, profit, and future guidance. Investors scrutinize whether a company beat or missed analyst expectations on earnings per share (EPS) and revenue, and more importantly, the outlook provided by management for upcoming quarters. Strong guidance can send a stock soaring, even if past earnings were merely in line. Conversely, a weak outlook, regardless of past performance, can trigger sharp declines. These reports often create significant volatility and trading opportunities.
Sectoral Trends and Rotation
Beyond individual stocks, observing which sectors are leading or lagging can indicate broader market sentiment. For example, a shift towards defensive sectors (utilities, consumer staples) suggests investor caution, while a rotation into cyclical sectors (technology, industrials, consumer discretionary) often signals optimism about economic growth. These rotations can be driven by changes in interest rate expectations, commodity prices, or evolving consumer preferences. Understanding these trends helps identify where capital is flowing and which parts of the market are gaining or losing favor.
Geopolitical Events and Global News
External factors, often unpredictable, can introduce significant volatility and risk into the market.
International Trade Relations
Developments in global trade agreements, tariffs, and diplomatic relations between major economic powers can have widespread effects. Tensions or resolutions impact supply chains, commodity prices, and the profitability of multinational corporations. For instance, new tariffs on key goods can increase production costs for some industries and make exports less competitive for others, leading to sector-specific and broader market reactions.
Political Stability and Conflicts
Geopolitical events, such as regional conflicts, political instability in key resource-producing nations, or significant election outcomes, can trigger immediate market responses. These events often lead to a "flight to safety," where investors move capital into perceived safe-haven assets like gold, the U.S. dollar, or government bonds, while selling off riskier assets like equities. Energy prices, in particular, are highly sensitive to geopolitical tensions in oil-producing regions.
Market Sentiment and Technical Levels
Beyond fundamentals, the psychological aspects of the market and price action itself play a crucial role.
Volatility Indices
Indices like the CBOE Volatility Index (VIX), often called the "fear gauge," measure the market's expectation of future volatility based on S&P 500 options. A rising VIX typically signals increasing investor anxiety and often precedes or accompanies market downturns. A declining VIX suggests complacency or a return to stability. Monitoring this index provides a real-time pulse on market sentiment.
Key Support and Resistance Levels
Technical analysis involves identifying price levels where buying (support) or selling (resistance) pressure is expected to be strong.
- Support levels: Price points where a downtrend is expected to pause due to concentrated buying interest.
- Resistance levels: Price points where an uptrend is expected to pause due to concentrated selling interest.
Breaking above resistance or below support can signal a continuation of a trend or a reversal. Traders and institutional investors often use these levels to make entry and exit decisions, creating self-fulfilling prophecies as price approaches these thresholds.
Pro Tip: While monitoring daily market movements is essential, distinguish between short-term noise and long-term trends. Overreacting to every data point or news headline can lead to poor decision-making. Focus on how new information alters the fundamental outlook for assets or the broader economy, rather than chasing every intraday fluctuation.
Synthesizing Daily Market Signals
Successfully navigating the stock market today involves more than just glancing at headlines. It requires a systematic approach to identify and interpret the confluence of economic data, corporate news, geopolitical developments, and market sentiment. Begin each day by reviewing the economic calendar for scheduled data releases and central bank announcements. Simultaneously, check for major corporate earnings reports and any significant geopolitical news that broke overnight. Observe pre-market futures for an indication of opening sentiment. As the day progresses, monitor how different sectors react to news and data, and pay attention to volatility gauges. This integrated perspective allows for a more informed understanding of market drivers and potential opportunities or risks.
Frequently Asked Questions
How often should investors check these indicators?
Serious investors and market participants typically check these indicators daily, often before market open, during trading hours for real-time reactions, and after market close to prepare for the next day. The frequency depends on an investor's strategy; day traders might monitor continuously, while long-term investors might focus on weekly or monthly summaries.
Which indicator has the most immediate impact on the market?
Interest rate decisions from major central banks and key economic reports like Non-Farm Payrolls or CPI often have the most immediate and significant impact on broad market indices and currency valuations, sometimes causing sharp movements within minutes of their release.
Can small investors benefit from watching these daily market movers?
Yes, understanding daily market movers helps small investors avoid making emotional decisions based on incomplete information. It provides context for market volatility, helps identify potential risks, and can inform decisions about when to buy or sell, even for long-term strategies.
What is the difference between economic news and corporate news impact?
Economic news (e.g., inflation, employment) primarily impacts the overall market, sectors, and asset classes by influencing monetary policy and broad economic outlook. Corporate news (e.g., earnings reports, product launches) primarily impacts individual company stock prices and, to a lesser extent, their specific sector.